How iFLUX supports tidal marsh restoration in the Bankbusters project
In the Scheldt estuary, tidal marshes are under constant pressure from erosion, resulting from strong wave action and harsh environmental conditions....
3 min read
 Goedele Verreydt
:
Apr 30, 2024 12:25:38 PM

Posted on Wednesday 10 March 2021
Real-time groundwater flux sensing depends on in-depth knowledge of many different conditions that impact groundwater dynamics, specifics of monitoring wells as well as parameters affecting sensor performance over time. Think about all different types of soils and their conductivity. There is, however, only so much we can test in our laboratory. That is why at iFLUX, we not only have our physical laboratory, we also have a virtual lab!
CFD is commonly used for research and engineering in natural sciences, environmental engineering, weather simulation, aerospace analysis and so on.
With Computational fluid dynamics (CFD) we make simulations of our sensor designs and the environment in which they can be installed. Using these simulations we can play with environmental and mechanical design parameters to see how they influence the measured results. You can compare it to experimenting with the digital sensor by putting several versions of it in different types of soils or monitoring wells. Except, we do not have to actually install hundreds of sensors. We can just simulate the different designs, different soil types and so on and therefore gradually improve the sensor design.
This virtual lab enables us to improve the mechanical design of the product without actually having to go through thousands of installations. We can for example simulate different soil types, and well filter packs, each one with its own conductivity, to estimate the impact of conductivity on the flux measurements with the digital sensor.
CFD even enables experiments with specific soil types that are not possible in a physical lab.
From these simulations we can construct a database of corrections for the flux data and sensor design optimizations. These corrections are crucial to deliver qualitative flux results in a dashboard instead of raw data. These corrections can in fact be compared to the alpha factor of our passive samplers.
The alpha factor is the ratio between the flux measured in the monitoring well and the effective flux in the soil. The calculation of alpha considers the permeability and thickness of each of the media through which the flux passes (cartridge, monitoring well trenches, gravel pack or filter pack and aquifer).
These corrections however are only part of the journey that our sensor data is taking from the sensor to the end customer. The data architecture and data flow play an important role in our digital sensor to deliver qualitative results.
The dataflow therefore not only contains components to collect, store, and visualize the data which is transmitted wirelessly from the sensors, but also requires dedicated quality control.
This is where our virtual lab comes in again. The corrections that resulted for the CFD simulations are done on the data from the digital sensor before it gets visualized in a dashboard to our customers.
That way our customers get to see the actual continuous groundwater flow results real-time.
This might all seem rather abstract, so here are some examples of what we found and corrected our data for.
Needless to say that groundwater flow around a monitoring well can exhibit complex behavior.
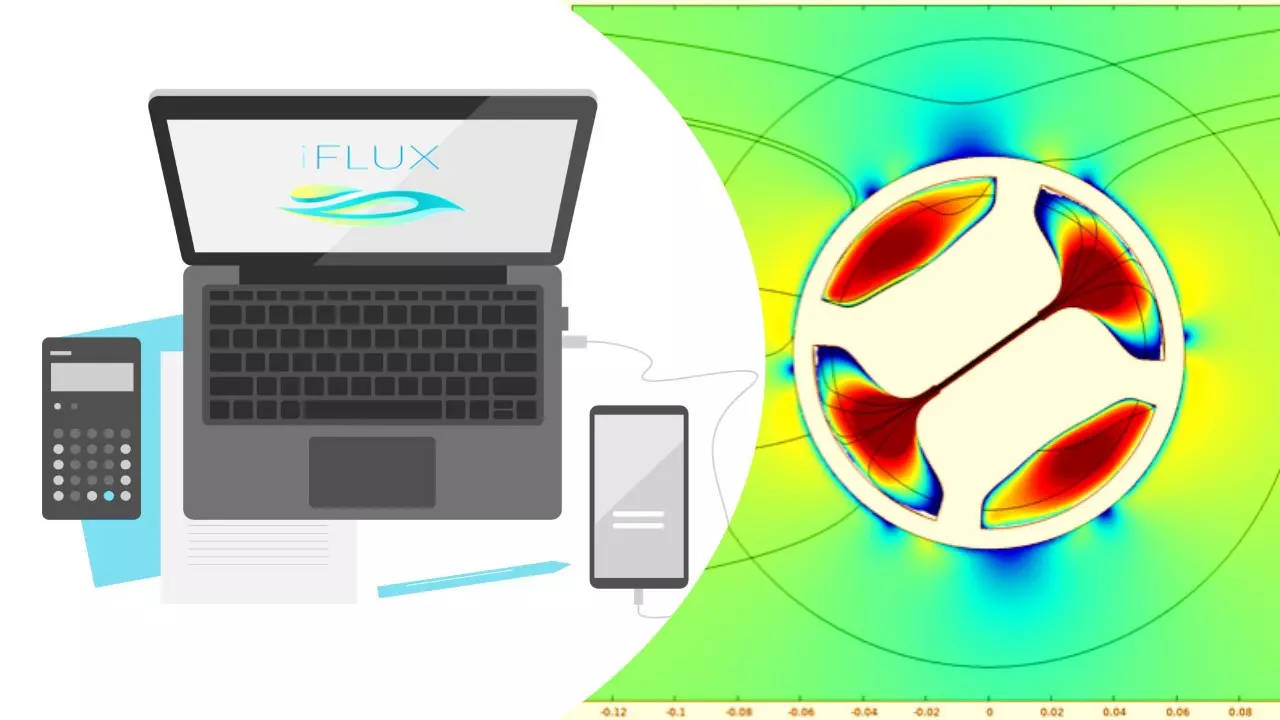
The CFD model below illustrates the acceleration relative to the actual groundwater speed. Red indicates an acceleration of the groundwater compared to the actual groundwater flow. Blue indicates that the groundwater is slowed down in these zones compared to the actual groundwater speed. After modelling and calculating these accelerations we correct the measured flux results for these influences.

This second example is about what happens when there is a blind part above or below the sensor, it creates more flow through the sensor itself. This simulation enables us to correct for this increased flow or even create an optimal well design specific for flux measurements. By correcting for these influences, we are able to report the actual groundwater flow instead of the accelerated flow caused by sensor design or the specific monitoring well.

Another interesting finding tackles horizontal slits of monitoring wells. These types of monitoring wells have ‘blind’ parts without openings. To measure groundwater flow, the sensor measures best where the well is slotted instead of at a blind part where there is less groundwater flow. The uncertainty of the exact placement of the sensor compared to these blind parts of the monitoring well is therefore measured by simulations.
Other simulations calculated the alpha of groundwater fluxes in function of the k factor.
If you have an interesting project for continuous real-time flux measurements, be sure to let us know via info@iflux.be
.jpg)
In the Scheldt estuary, tidal marshes are under constant pressure from erosion, resulting from strong wave action and harsh environmental conditions....

Posted on Tuesday 2 March 2021 A lot has changed since the start of iFLUX and its more than 80 different projects. We have learned a...

Posted on Tuesday 1 December 2020 Since last month, iFLUX is contributing to a study in Poland where we can test our newly developed digital...